|
Local Government Help > Documentation > Drawing Tools
|
The powerful GovClarity Drawing Tools enable you to customize your maps to fit your needs by drawing shapes and lines, and placing icons, labels, and overlays on the map. Custom maps are a great addition to marketing brochures, reports, or property lists.
You can also use the Draw Tools to constrain a search. Learn all of the options for limiting your search to boundaries (e.g. zip code, city, user drawn). |
Target Layer Overview
All of your drawings in GovClarity get added to a Layer. You can choose to add your drawings to an existing layer or a new layer depending on what you'll use your drawings for. The active layer that your drawings are added to is called the Target Layer. The top of the Drawing Tools menu displays the name of the Target Layer. If you need to change the Target Layer simply select Change Target Layer from the Drawing Tools menu. A GovClarity best practice is to organize your drawings into multiple layers.
GovClarity enables you to:
- Create new Markup Layers to use as target layers. Markup layers are the most flexible drawing layers.
- Select existing layers to use as target layers
|
 |
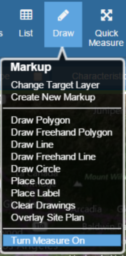
| To open the Drawing Tools menu, click the Drawing icon in the Main Toolbar or on the target layer Drawing icon in the Legend. (You may have to scroll down the Legend to view your target layer.) |

|
Drawing Polygons, Lines, and Circles
- Click the Drawing icon in the Main Toolbar.
- Click Draw Polygon, Draw Line, or Draw Circle from the menu.
Note: Before you begin to draw, you can format the shape or line using the Drawing Toolbar (See definitions below). To cancel drawing, click the Delete button from the Drawing Toolbar.
- Click on the map to begin your drawing. Let up on the mouse button, and move your mouse over the map to draw.
- Polygons: Click at the end of a line to start a new side. After drawing the last side, double-click to close the polygon.
- Line: Double-click to end the line.
- Circle: Single-click to complete the circle.
Note: There are two ways to precisely size a circle you've drawn.
- First, you can input a radius value on the Drawing Toolbar. Your circle size can be in feet, miles, meters, or kilometers.

- Alternatively, you can select Measure On from the Drawing Tools menu before you draw a circle. While you are drawing, the Measure Tool dynamically displays the circle's circumference, radius, and area. To turn off the Measure Tool, select Measure off from the Drawing Tools menu. (See Related Documents below.)
|


|
| Here's how to format your drawing from the Drawing Toolbar: |
 |
- The Drawing Toolbar appears at the bottom of the map screen once a Drawing layer is active.
- Fill Color: Select the fill color and opacity for the drawing by clicking on the Fill Color color swatch. The Fill Color window appears. (See How to Use the Color Selector below for instructions.)
Note: Fill color does not apply to lines.
|
 |
- Line Color: Select the line color for the drawing by clicking on the Line Color color swatch. The Stroke Color window appears. (See How to Use the Color Selector below for instructions.)
- Line Style: Select the line style from the drop-down list.
- Line Width: Select the line width from the drop-down list.
- Attributes: Add a note or label for your drawing.
- View Info: Click on Commands at the bottom of the Markup window to modify your drawing. (See Markup Window Commands below for definitions of the menu options.)
- OK: Click to accept your selections. The Drawing Toolbar closes and the drawing is de-selected.
|
 |
Note: When you click on a drawing, an animation may move to the top right corner of GovClarity and the Notification icon  appears. This happens if more than one layer is on the map screen besides your target layer. Click the Notification icon to open a menu that lists the layers. Select a layer to work on by clicking on it. In the example to the right, the target layer is Markup. appears. This happens if more than one layer is on the map screen besides your target layer. Click the Notification icon to open a menu that lists the layers. Select a layer to work on by clicking on it. In the example to the right, the target layer is Markup. |
 |
To delete a polygon, line, or circle:
- Click on the drawing if it isn't already selected so that it is active (blue squares appear on the drawing).
- Click the Delete button
 on the Drawing Toolbar. on the Drawing Toolbar.
|
Placing an Icon on the Map
- Click the Drawing icon in the Main Toolbar.
- Click Place Icon on the menu.
Note: Before you place the icon on the map, you can move it using your mouse, and format it using the Drawing Toolbar (See definitions below). To cancel placing the icon, click the Delete button on the Drawing Toolbar.
- Click on the map where you'd like to place the icon. You can move the icon by clicking on it, and while holding the mouse down moving it to your desired location. To de-select the icon, click on the map. To select the icon, click on it. A selected icon is boxed.
Note: You can rotate a selected icon by clicking on the green point at the end of the dashed line, and while holding the mouse down turning it to your desired location.
|
 |
Here's how to format an icon from the Drawing Toolbar:
- The Drawing Toolbar appears at the bottom of the map screen once an icon is active.
- Image: Click on the Image icon. The Image window appears. Select an icon from the Public or Custom tab, or load a new icon by clicking the Upload button on the Custom tab.
- Fill Color: Select the fill color and opacity for the icon by clicking on None or the Fill Color color swatch. The Fill Color window appears. (See How to Use the Color Selector below for instructions.)
- Size: Select the size of the icon from the drop-down list.
- Attributes: Add a note or label for your icon.
- View Info: Click on Commands at the bottom of the Markup window to modify your icon. (See Markup Window Commands below for definitions of the menu options.)
- OK: Click to accept your selections. The Drawing Toolbar closes and the icon is de-selected.
|


|
To delete an icon:
- Click on the icon if it isn't already selected so that it is active. (A selected icon is boxed.)
- Click the Delete button on the Drawing Toolbar.
|
Placing a Label on the Map
- Click the Drawing icon in the Main Toolbar.
- Click Place Label on the menu.
- Type your label in the Enter Label Text window. You can use multiple lines of text.
- Click the Ok button.
Note: Before you place the label on the map, you can move it with your mouse, and format it from the Drawing Toolbar (See definitions below). To cancel placing the label, click the Delete button from the Drawing Toolbar.
- Click on the map where you'd like to place the label. You can move the label by clicking on it, and while holding the mouse down moving it to your desired location. To de-select the label, click on the map. To select the label, click on it. A selected label is boxed.
Note: You can rotate a selected label by clicking on the green point at the end of the dashed line, and while holding the mouse down turning it to your desired location. This feature is useful when you need to place street labels on the centerline of a street.
|


|
Here's how to edit the text of a label on the map:
- Click the label.
- Click Attributes
 on the Drawing Toolbar. on the Drawing Toolbar.
- Edit the text in the Label field of the Edit Attributes window.
- Click the Save button.
|
| Here's how to format a label from the Drawing Toolbar: |

|
- Fill Color: Select the fill color and opacity for the label by clicking on the Fill Color color swatch. The Fill Color window appears. (See How to Use the Color Selector below for instructions.)
- Line Color: Select the line color for the label by clicking on the Line Color color swatch. The Stroke Color window appears. The line color outlines the text. (See How to Use the Color Selector below for instructions.)
- Font: Select a font from the drop-down list.
- Font Size: Select a font size from the drop-down list.
- Geo Lock: The Off default setting enables you to view a label no matter how far you zoom out. The On setting enables you to lock a label to geographic scale. That means that the label acts like any feature on the earth, such as a house. The further you zoom away from it the less you can see it, until it disappears.
- Attributes: The Edit Attributes window enables you to add or edit Notes. In addition, the Label field displays your label text, which you can edit if desired.
- View Info: Click on Commands at the bottom of the Markup window to modify your label. (See Markup Window Commands below for definitions of the menu options.)
- OK: Click to accept your selections. The Drawing Toolbar closes and the label is de-selected.
|
|
To delete a label:
- Click on the label if it isn't already selected so that it is active. (A selected label is boxed.)
- Click the Delete button on the Drawing Toolbar.
|
Overlaying a Site Plan on the Map
- Click the Drawing icon in the Main Toolbar or the Drawing icon on the target layer in the Legend.
- Click Overlay Site Plan on the menu.
- Select an Image from the Shared or User tab, or load a new image by clicking the Upload button.
Note: GovClarity accepts gif, jpg, tiff, and png files.
|


|
- Click the OK button. The image loads on the map, and the Set Control Points window opens in the upper right corner of GovClarity.
- Follow the steps in the Set Control Points window to place the Site Plan on the map:
- Please select a point on the image. Click on the image at the first point you would like to set on the map. For example, you might click on the bottom left corner of the image.
- Now select the corresponding point on the map.
- Move the cursor, which is at the tip of a black arrow, to the place on the map that the place you selected in your image corresponds to.
- Click to set this first control point. A blue pin
 appears at the point. appears at the point.
- Please select another point on the image. Click on the image at the second point you would like to place on the map. For example, you might click on the top right corner of the image.
- Please select a corresponding point on the map.
- Move the cursor/arrow to the place on the map that you just clicked on the image.
- Click to set this control point. This places the image, in a bounding box, at the desired location on the map. The Drawing Toolbar also opens. You might have to align your image to place it perfectly on the map. (See below for tips).
|


|
Here are three ways to align your image on the map:
- Click and drag this cursor
 to move the image. to move the image.
- Click on the green point at the end of the dashed line
 to pivot the image around the blue pin. to pivot the image around the blue pin.
- Click and drag a corner point
 on the bounding box to resize the image. on the bounding box to resize the image.
|

|
Here's how to format the image:
Click the image to select it if it isn't already selected. The Drawing Toolbar opens.
Tip: If you have difficulty selecting the image, enable the Identify feature on your target layer in the Legend. Click the button nearest to the layer name. The red ''i''  on the button means that Identify is enabled. on the button means that Identify is enabled.
|


|
- Image: Displays a thumbnail of your selected image.
- Opacity: Select the opacity for your image. The opacity range is 5% (clear) to 100% (no opacity). An image with 5% opacity is not visible on the map.
- Attributes: Add a note or label for your image.
- View Info: Click on Commands at the bottom of the Markup window to modify your image. (See Markup Window Commands below for definitions of the menu options.)
- OK: Click to accept your selections. The Drawing Toolbar closes and the image is deselected.
- Delete: Delete the image.
|
Changing the Target Layer
- Click the Drawing icon in the Main Toolbar or on the target layer in the Legend.
- Click Change Target Layer.
- Select a target layer from the drop-down menu of the Set Target Layer window.
Note: To turn off the target layer feature, select None from the drop-down menu. To enable the feature, select Change Target Layer from the Drawing Tools menu.
- Click the Ok button. The top of the Drawing Tools menu displays the name of your selected target layer.
|


|
Creating a New Markup Layer
- Click the Drawing icon in the Main Toolbar.
- Click Create New Markup in the menu.
- In the Create New Markup Layer window:
- Select a Folder from the drop-down menu to save your new markup layer. Your Drawings folder is the default. Only you have access to view and edit its contents.
- Type a Name for your new markup layer. The example name to the right is Project1.
- Click the OK button. GovClarity assigns your new markup layer as the target layer. Its name appears at the top of the Drawing Tools menu.
|


|
Using the Measure Tool
|
Use the Measure Tool to accurately measure any parcel or any area (polygon or circle) or line that you draw on the map. (See Related Documents below.)
|
|
How to Use the Color Selector
The Color Selector works the same for both Fill Color and Line Color, except that the opacity setting does not apply to Line Color. Each color has Red, Green, and Blue (RGB) values. The values range from 0 to 255. Fill Color has an Alpha value for opacity. Opacity value ranges from 0.0 (clear) to 1.0 (solid color).
Tip: If you want to use the exact same color more than once, it is best practice to write down its RGB values. For Fill Color, also write down the Alpha value for opacity. In the Color Selector window, enter the values in the appropriate fields.
- If the box next to Use Color is not checked, click it to activate the Color Selector.
- To pick a color using the Color Wheel, click on the wheel. To change the shade of the color, move your mouse in the box inside the wheel.
- To select the opacity for Fill Color only, move the slider.
|
|
Markup Window Commands
Click the View Info icon  on Drawing Toolbar to open the Markup window. Click the Commands button. Here are the unique commands on the menu: on Drawing Toolbar to open the Markup window. Click the Commands button. Here are the unique commands on the menu:
- Copy Geometry: Enables you to copy a drawing from one layer to another.
- Add as Inclusion: See Related Documents below.
- Add as Exclusion: See Related Documents below.
- View in Google Earth: See Related Documents below.
|
|
Related Information
|